How To Write Performant Go Code
I suppose all of us programmers have heard of the infamous premature optimization:
Premature optimization is the root of all evil in programming.
Really? I don’t think so.
The full quote from the must-read The Art of Computer Programming by Donald Knuth:
The real problem is that programmers have spent far too much time worrying about efficiency in the wrong places and at the wrong times; premature optimization is the root of all evil (or at least most of it) in programming.
Like so many pearls of wisdom, they are a child of their own time. They are usually dangerously separated from their context to underline the message the next author wants to emphasize their statement. I believe most of us have only read the shortened, i.e., wrong version of the quotation.
I claim that if keeping performance is your second nature, it’ll not ruin the other quality attributes of your code, but the opposite. All you need to do is to follow some basic rules with your muscle memory.
Performance Rules
In this post, I concentrate only on these three:
- A function call is computationally expensive if the compiler cannot inline expanse it, i.e. do function inlining. When inlining, the compiler produce machine code, that doesn’t include real sub-routine calls with argument transportation either stack or CPU registers, and unwinding the stack and copy results to desired memory locations after the call returns. With function inlining you can think that the compiler copy/paste your function’s machine instructions to all of those places where it’s called.
- Heap allocations are computationally expensive. (We out-scope garbage collection algorithms because they’re such a significant topic that even one book is insufficient. Still, it’s good to know that heap allocation pressurize a garbage collector.)
- Minimize the problem space at every level of abstraction and the need
for variables, i.e. especially in inner loops. Consider what parts of
inputs are really varying and what parts are constant. For example, think
twice if you need
regexinside of your program.
Function Inlining
Let’s write our version of the famous assert function to show how function
inlining can help readability outside of the tests without sacrificing
performance.
func assert(term bool, msg string) {
    if !term {
        panic(msg)
    }
    ...

func doSomething(p any, b []byte) {
    assert(p != nil, "interface value cannot be nil")
    assert(len(b) != 0, "byte slice cannot be empty (or nil)")
    ...
    // continue with something important
By writing the benchmark function for assert with Go’s testing capabilities,
you can measure the ‘weight’ of the function itself. You get the comparison
point by writing the reference benchmark where you have manually inline-expansed
the function, i.e. by hand. It would look like this:
func doSomethingNoAssert(p any, b []byte) { // for benchmarks only
    if p != nil {
        panic("interface value cannot be nil")
    }
    if len(b) != 0 {
        panic("byte slice cannot be empty (or nil)")
    }
    ...
    // continue with something important
Note, this would be your reference point only. (I’ll show how to turn off inlining with Go compiler flags, which would work as a good benchmarking reference for some cases.)
And, if you aren’t interested in the actual performance figures but just the information about successful inline expansion done by the compiler, you can ask:
go test -c -gcflags=-m=2 <PKG_NAME> 2>&1 | grep 'inlin'
The -gcflags=-m=2 gives lots of information, but we can filter only those
lines that contain messages considering the inlining. Depending on the size of
the packages there can be an overwhelming lot of information where most of them
aren’t related to the task in your hand. You can always filter more.
The -gcflags will be your programming buddy in the future. To get more
information about the flags, run:
go build -gcflags -help
Naturally, you can use compiler to give you a reference point for your inline optimizations as I said before.
Disable all optimizations:
go test -gcflags='-N' -bench='.' <PKG_NAME>
Disable inlining:
go test -gcflags '-l' -bench='.' <PKG_NAME>
Memory Allocations
Similarly, as function calls, the memory allocations from the heap are expensive. It’s good practice to prevent unnecessary allocations even when the programming platform has a garbage collector. With the Go, it’s essential to understand the basics of memory management principles Go uses because of memory locality, i.e., it has pointers and value types. Many other garbage-collected languages have object references, and the memory locality is hidden from the programmer, leading to poor performance, e.g., cache misses.
But nothing comes for free—you need to know what you’re doing. Go’s compiler analyzes your code and, without your help, can decide if a variable is escaping from its scope and needs to be moved from a stack to the heap.
Go’s tools give you extra information about escape
analyzes. Use the
-gcflags=-m=2 again, but grep escape lines from the output. That will tell
you exactly what’s going on with the pointers for every function in the current
compilation.
Usually, when benchmarking Go code, it’s good to understand what’s going on with heap allocations. Just add the following argument e.g., your test benchmark compilation, and you get the statistics of allocations in the benchmark run.
go test -benchmem -bench=. <PKG_NAME>
The -benchmem flag inserts two columns to benchmarking results:
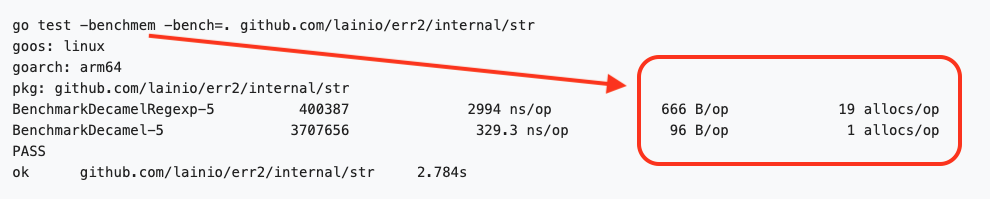
Benching Memory Allocations
Please note that five (5) columns are now instead of standard three. The extra
two (rightmost and marked with red rectangle) are the about memory allocations.
B/op is the average amount of bytes per memory allocation in the rightmost
column allocs/op.
Fewer allocations, and the smaller the size of the allocations, the better. Please note that the performance difference between the above benchmark results isn’t because of the allocations only. Most of the differences will be explained in the following chapters. But still, allocations are something you should be aware of, especially about the variable escaping if it leads to heap allocations.
How Dynamic Are The Inputs?
How much do the variables in your program change, or maybe they are constant? Naturally, the smaller the actual input set of the function, the better chance we have to optimize its performance because the more deterministic the solution will be. Also, smaller machine code performs better in modern memory-bound CPUs. The same cache rules apply to instructions as variables. CPU doesn’t need to access RAM if all the required code is already in the CPU.
The above benchmark results are from two functions that do the same thing. This is the regex version of it (first row in the benchmark results):
var (
	uncamel = regexp.MustCompile(`([A-Z]+)`)
	clean   = regexp.MustCompile(`[^\w]`)
)

// DecamelRegexp return the given string as space delimeted. Note! it's slow. Use
// Decamel instead.
func DecamelRegexp(str string) string {
	str = clean.ReplaceAllString(str, " ")
	str = uncamel.ReplaceAllString(str, ` $1`)
	str = strings.Trim(str, " ")
	str = strings.ToLower(str)
	return str
}
Go’s regex implementation is known to be relatively slow, but if you think that regex needs its compiler and processor, it’s not so surprising.
The hand-optimized version of the Decamel function is almost ten times faster. It sounds pretty much like it’s natural because we don’t need all the versatility of the entire regex. We need to transform the inputted CamelCase string to a standard lowercase string. However the input strings aren’t without some exceptions in our use case because they come from the Go compiler itself. (The inputs are from Go’s stack trace.) And still, the input set is small enough that we quickly see the difference. And now, we can shrink the problem space to our specific needs.
The 1000%-faster version of Decamel that’s still quite readable:
func Decamel(s string) string {
     var (
          b           strings.Builder
          splittable  bool
          isUpper     bool
          prevSkipped bool
     )
     b.Grow(2 * len(s))

     for i, v := range s {
          skip := v == '(' || v == ')' || v == '*'
          if skip {
               if !prevSkipped && i != 0 { // first time write space
                    b.WriteRune(' ')
               }
               prevSkipped = skip
               continue
          }
          toSpace := v == '.' || v == '_'
          if toSpace {
               if prevSkipped {
                    continue
               } else if v == '.' {
                    b.WriteRune(':')
               }
               v = ' '
               prevSkipped = true
          } else {
               isUpper = unicode.IsUpper(v)
               if isUpper {
                    v = unicode.ToLower(v)
                    if !prevSkipped && splittable {
                         b.WriteRune(' ')
                         prevSkipped = true
                    }
               } else {
                    prevSkipped = false
               }
          }
          b.WriteRune(v)
          splittable = !isUpper || unicode.IsNumber(v)
     }
     return b.String()
}
Let’s take another example where results are even more drastically faster, but the reason is precisely the same. The input set is much smaller than what the first implementation function is meant to be used.
The results:
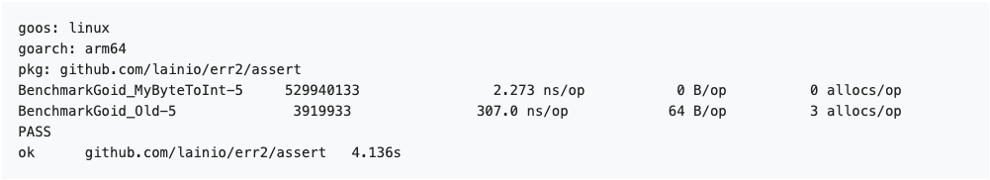
Benching Get Goroutine ID
The first implementation:
func oldGoid(buf []byte) (id int) {
     _, err := fmt.Fscanf(bytes.NewReader(buf), "goroutine %d", &id)
     if err != nil {
          panic("cannot get goroutine id: " + err.Error())
     }
     return id
}
The above code is quite self explanatory, and that’s very good.
The second and fasterfastest implementation:
func asciiWordToInt(b []byte) int {
     n := 0
     for _, ch := range b {
          if ch == ' ' {
               break
          }
          ch -= '0'
          if ch > 9 {
               panic("character isn't number")
          }
          n = n*10 + int(ch)
     }
     return n
}
These two functions do precisely the same thing, or should I say almost because the latter’s API is more generic. (In a way, we are both narrowing and widening the scope simultaneously, huh?) The converted integer must start from the first byte in the slice of ASCII bytes.
It is much over 100x faster! Ten thousand percent. Why?
Because the only thing we need is to process the ASCII string that comes in as a byte slice.
You might ask whether this ruined the readability, which is fair. But no, because the function
asciiWordToIntis called fromGoroutineID, which is just enough—trust abstraction layering. (See the rule #1.)
Next time you are writing something, think twice—I do 😉
P.S.
There is so much more about performance tuning in Go. This piece was just a scratch of the surface. If you are interested in the topic, please get in touch with our project team, and we will tell you more. We would be delighted if you join our effort to develop the fastest identity agency.